Facilities, megawatts, permits and promises. A look at the open research AIT members are building on the AI economy, and how you can join it.
Every AI model runs on a building somewhere: a hall of racks, a grid connection, a water supply and a set of permits. AIT's AI Datacenters investigation tracks those buildings in the open. Each facility gets an operator, location, capacity, power source, suppliers and sources, and members can verify what others submit.
What the investigation reports#
These figures are copied from the live investigation pages, checked on 30 Oct 2026 at about 10:15 CET. The site says the data was last updated on 29 Oct 2026.
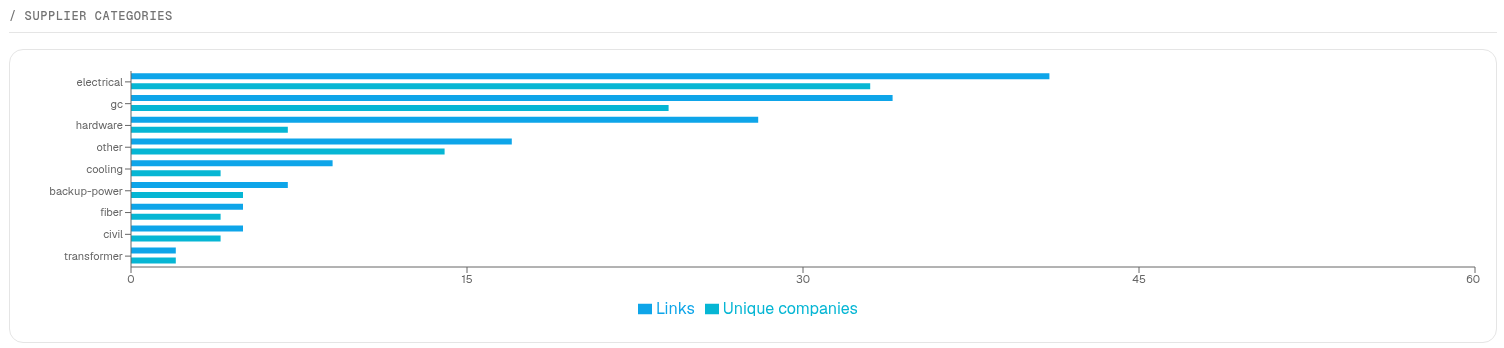
- 376 verified facilities in 41 countries, adding up to 98,768 MW, with another 83,026 MW planned. 153 of them are AI-dedicated, and the data holds 148 supplier links across 96 companies. Source: AIT Investigations.
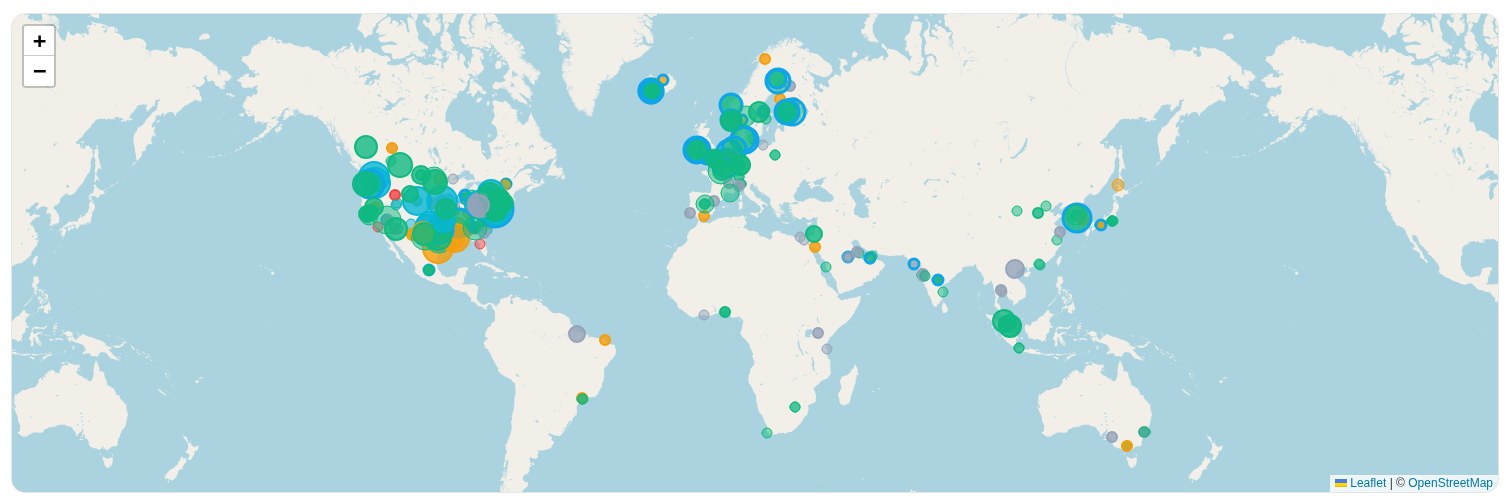
Where AI's datacenters are: 376 verified facilities, sized by MW.
- The three largest operators hold 42% of tracked MW. By current capacity, the market power view lists Amazon Web Services (38 sites, 3,950 MW), Meta (22 sites, 1,207 MW) and Microsoft (39 sites, 1,187 MW). By planned MW, Meta leads with 9,610 MW. Source: Market power.
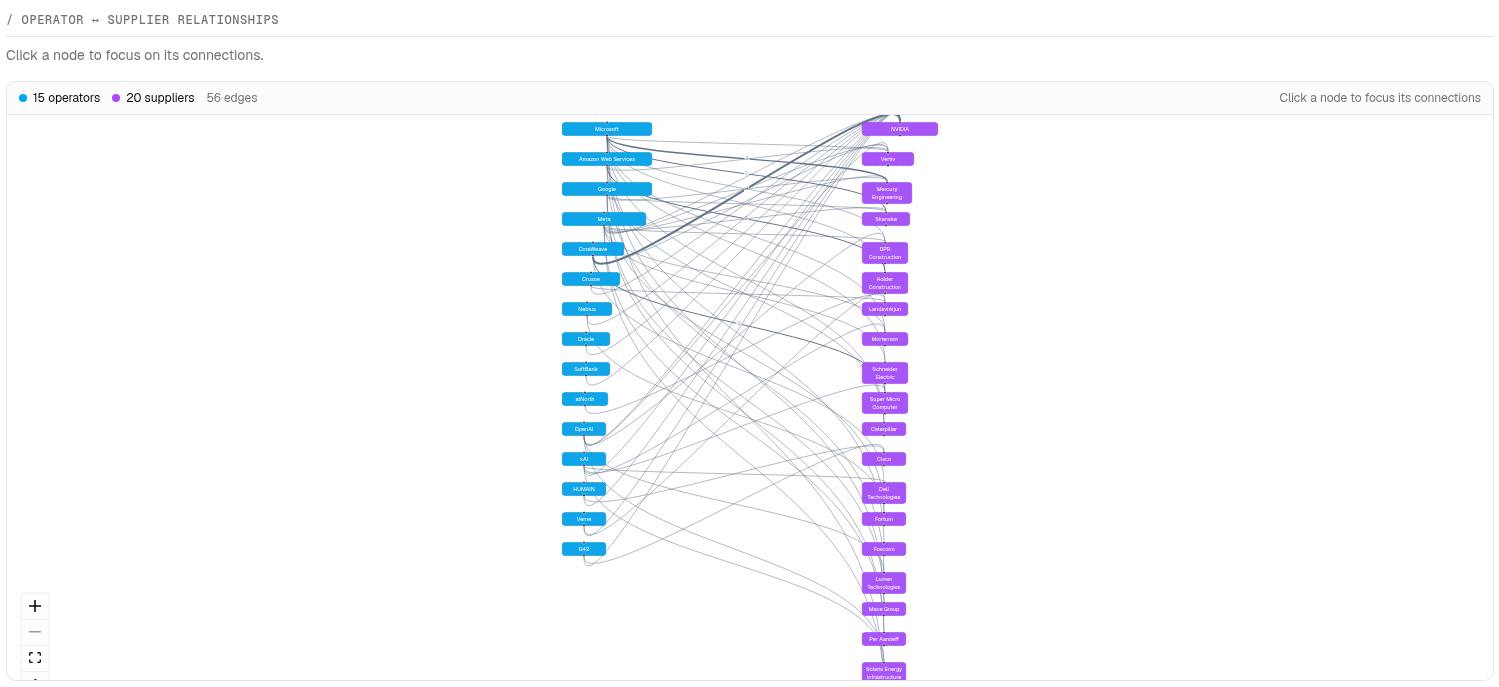
Who supplies whom: 15 operators, 20 suppliers, 50 links.
- The biggest single entry is the AWS Northern Virginia Cluster in Ashburn, VA, at 3,000 MW. The page records a Loudoun County zoning permit issued 590 days after application, and a $929.0M Virginia sales and use tax exemption. Sources: AIT facility page and Loudoun County, Data Centers.
- xAI's Colossus in Memphis is listed with $160.0M in disclosed incentives against 600 claimed jobs, which works out to about $267k per job. The ownership chain runs from xAI through X Corp to xAI Holdings Corp. Sources: AIT facility page, xAI, Colossus and TechCrunch on xAI acquiring X.

The red flags#
The Red flags page surfaces entries that stand out from their peers. In the investigation's own words, these flags are "descriptive, not editorial", and patterns "warrant review, not accusations".
- Greenwash gap. The page compares each operator's public clean-energy pledge with its actual carbon-free share of tracked MW. Meta pledged 100% by 2020 and shows 9.4%. Amazon Web Services pledged 100% by 2025 and shows 18.8%. Microsoft pledged 100% by 2025 and shows 50.6%. The pledges come from Meta Sustainability, Amazon's Climate Pledge and Microsoft's carbon-negative announcement. In total, 23 operators are flagged as 30 or more points behind their commitment.
- Subsidies above $1M per claimed job: 10 facilities.
- Countries where one operator dominates (HHI of 2,500 or more): 25.
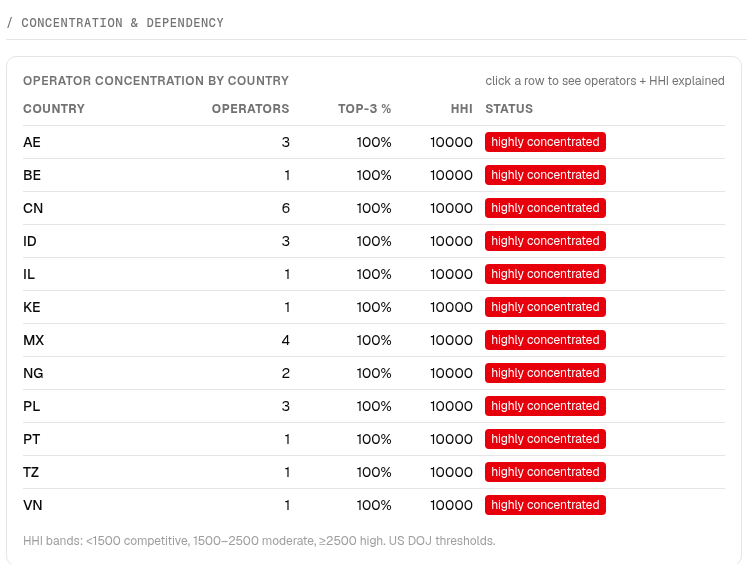
Operator concentration (HHI) by country.
- Data gaps: 5 facilities have no power source on record, 1 verified entry has no source, and 1 has been announced for five years or more without going live.
What we read into it#
This part is the editors' interpretation, not reporting. The gap between pledges and carbon-free capacity is the strongest signal here, but it only reflects the facilities AIT tracks so far. A larger sample could narrow or widen it. Concentration figures for small countries can also come from having only one or two facilities on record. The data shows where to look next. It isn't a verdict.
Why it matters#
Datacenters decide where AI's power, water and public money go. Permits, grid connections and tax breaks are public records, but they are scattered across council minutes, filings and press releases. An open, sourced map lets founders, researchers, journalists and local residents ask better questions. The Energy & growth view puts the power mix and the gap between announcements and completions on one page.
How you can contribute#
- Add a facility you know about. Every entry needs a source link.
- Verify what others submit. Check a permit, a capacity figure or a power deal against the original document.
- Close a gap. Start with the facilities that have no power source or no source on the Red flags page.
- Bring local knowledge. Council decisions and grid notices often show up in local news first.
Start at aitcommunity.org/en/investigations/datacenters.
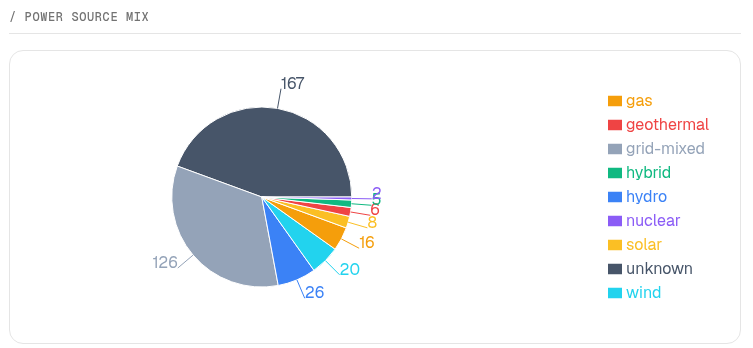
Power source mix: most capacity is unknown or grid-mixed.
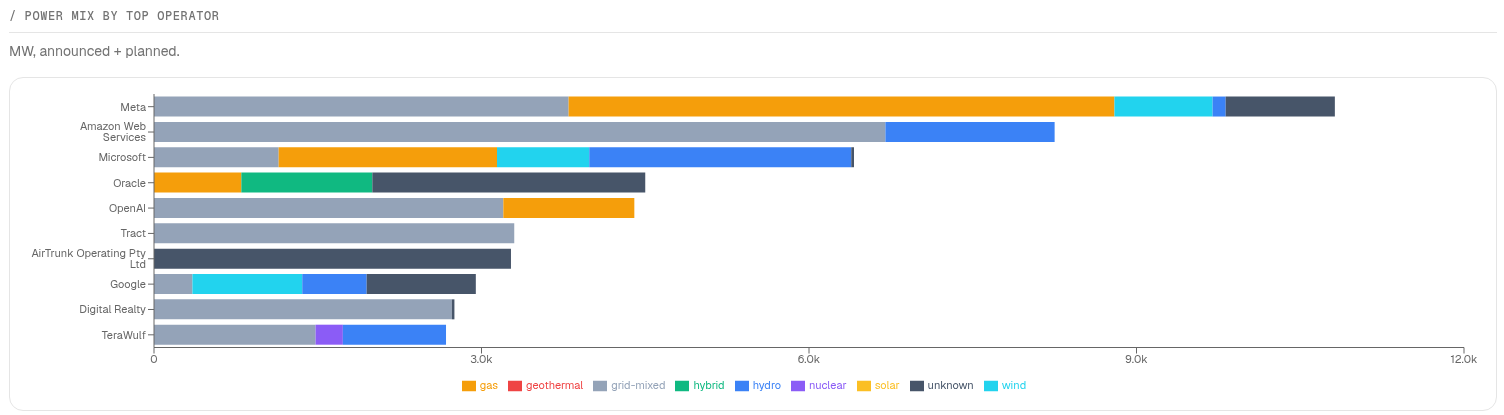
Announced and planned MW by operator; Meta, AWS and Microsoft lead.